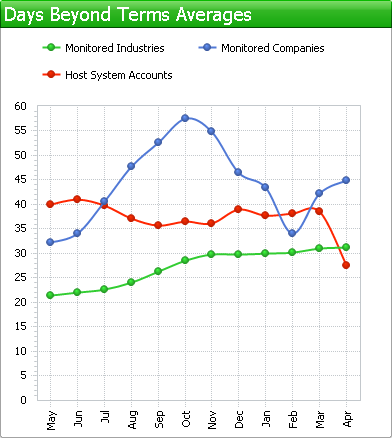
The chart shows you a monthly average over the last 12 months of how promptly the companies you are monitoring pay their bills and how promptly the customers from your accounts pay you. Up to three different series of data will be shown, depending if you have linked Credit Guardian to your accounts system and are monitoring companies.
The left axis is the number of days late that the companies pay. For example if a company is on payment terms of 60 days from invoice date and they pay on day 80, then the company pays 20 days beyond terms (80 - 60 = 20).
See What is Payment Performance and Limited Company Payment Profile tab for more information.
|
Copyright (c) 2007 - 2010 Draycir Limited. All rights reserved.
|
|
What do you think about this topic? Send feedback!
|


 Group
Group